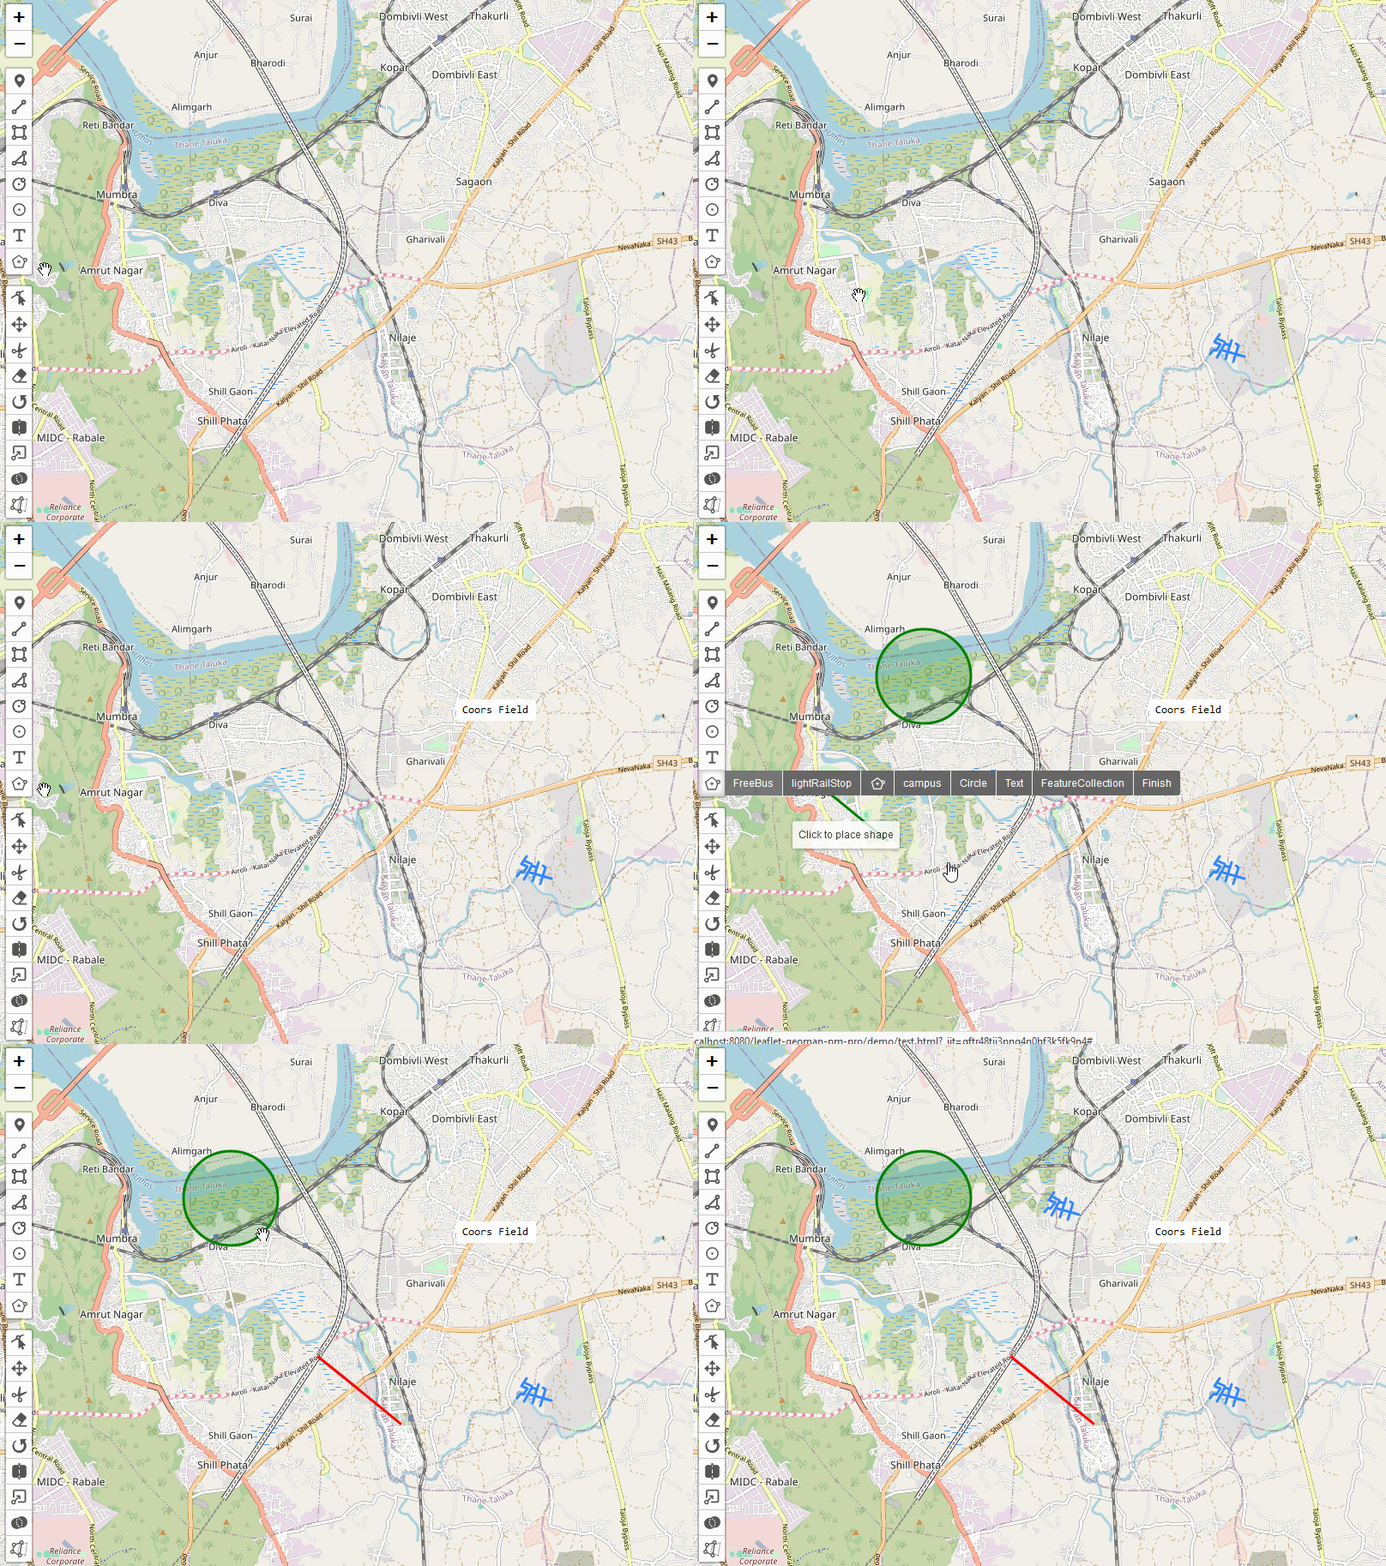
Custom Shapes Mode ⭐
Custom Shapes Mode ⭐

Custom Shapes Mode allows you to define and draw custom shapes on your map. This feature enables you to create predefined shapes, add them to a shape library, and even add custom shapes to the toolbar for easy access.
You can enable Custom Shape Draw Mode on a map like this:
// enable Custom Shape Draw Mode with a predefined shape
map.pm.enableCustomShapeDraw(polygonGeoJSON, {
  templineStyle: { color: 'red' },
  pathOptions: { color: 'green' },
});

// disable Custom Shape Draw Mode
map.pm.disableCustomShapeDraw();
The following methods are available on map.pm:
| Method | Returns | Description |
|---|---|---|
enableCustomShapeDraw(geoJSON, options) | - | Enable Custom Shape Draw Mode with the passed GeoJSON shape. The options are optional. |
| disableCustomShapeDraw() | - | Disable Custom Shape Draw Mode. |
| customShapeDrawEnabled() | Boolean | Returns true if Custom Shape Draw Mode is enabled. false when disabled. |
addCustomShape(name, geoJSON, options) | - | Add a custom shape to the internal shape library. |
removeCustomShape(name) | - | Remove a custom shape from the internal shape library. |
| getCustomShapes() | Object | Returns an object containing all custom shapes in the library. |
addCustomShapeToToolbar(name, options) | - | Add a custom shape to the toolbar. options can include text and title for the toolbar button. |
removeCustomShapeFromToolbar(name) | - | Remove a custom shape from the toolbar. |
Custom Shape Options
Custom Shape Draw Mode accepts the following options:
| Option | Default | Description |
|---|---|---|
| templineStyle | { color: '#3388ff' } | Style options for the temporary line while drawing. |
| pathOptions | null | Style options for the drawn shape. |
| customShapeGeoJSONOptions | null | Options for the GeoJSON layer, including style for styling and pointToLayer for point conversion. |
You can listen to map events to hook into the custom shape drawing procedure like this:
map.on("pm:drawstart", (e) => {
  console.log(e);
});
The events available are the same as those for regular Draw Mode, including pm:drawstart, pm:drawend, and pm:create.
Examples
Here are some examples of how to use Custom Shapes Mode:
// Add a custom shape to the library
map.pm.addCustomShape('polygon', polygonGeoJSON, {
  templineStyle: { color: 'red' },
  pathOptions: { color: 'green' },
});

// Add a custom shape from library to the toolbar
map.pm.addCustomShapeToToolbar('polygon', {
  text: 'Poly',
  title: 'Polygon',
});

// Enable drawing of a custom shape by referencing its id in the library
map.pm.enableCustomShapeDraw('polygon');

// Enable drawing of a custom shape by directly passing a GeoJSON shape
map.pm.enableCustomShapeDraw({
    type: 'Feature',
    properties: {},
    geometry:
    {
      type: "Polygon",
      coordinates: [
        [
          [7.456541, 51.512161],
          [7.461689, 51.518224],
          [7.46525, 51.515046],
          [7.470054, 51.517636],
          [7.472972, 51.511173],
          [7.469797, 51.50738],
          [7.461132, 51.507006],
          [7.460745, 51.509277],
          [7.456541, 51.512161],
        ],
      ],
    },
  });

// Remove a custom shape from the library
map.pm.removeCustomShape('polygon');

// Remove a custom shape from the toolbar
map.pm.removeCustomShapeFromToolbar('polygon');

// Get all custom shapes in the library
const customShapes = map.pm.getCustomShapes();
Custom Shape with Point to Layer Function
You can use the customShapeGeoJSONOptions to provide a pointToLayer function for converting GeoJSON points to Leaflet layers:
map.pm.enableCustomShapeDraw(pointGeoJSON, {
  customShapeGeoJSONOptions: {
    pointToLayer: (geoJsonPoint, latlng) => L.circle(latlng, { radius: 1000 })
  },
});
This will create a circle with a 1000-unit radius for each point in the GeoJSON.
Demo Examples
Draw a custom shape with a predefined GeoJSON shape:
Add a custom shape to the library and to the toolbar: