When working with geospatial data in Python, you will often want to visualize this data on a map. This is where Folium comes in handy. Folium is a library that builds on Python's strength in data manipulation and Leaflet's power of mapping. Simply said you can use Python to manipulate your data and Folium to visualize it. For that reason, Folium has become very popular as witnessed by its 2.2k forks and 6.6k stars on GitHub. While Folium is great for visualizing geospatial data on its own, it does not offer tools for manipulating this data directly on a map. This is where Geoman helps to complement Folium. In this blog post, we will guide you through how to create an interactive map using Geoman and Folium. We will be working in a Jupyter Notebook and you can find the full code in our GitHub repo.
Tutorial for using Geoman with Folium
In this tutorial, we will be working with a dataset of 25 lakes in GeoJSON
format that is available on https://geojson.xyz/. We start by setting up Folium
to import this by instantiating the GeoJson() class and using the add_to()
method on our Folium map.
# Import Folium

import folium

# Initialize the Folium map

m = folium.Map(location=(46.190361, -84.639612), zoom_start=6)

# Get the Lakes GeoJSON dataset from https://geojson.xyz/ and add it to the Folium map

lakes_url = (
    "https://d2ad6b4ur7yvpq.cloudfront.net/naturalearth-3.3.0/ne_110m_lakes.geojson"
)
folium.GeoJson(lakes_url).add_to(m)

# Render to map to ensure that html elements are loaded in the right order before adding Geoman scripts and controls

m.render()
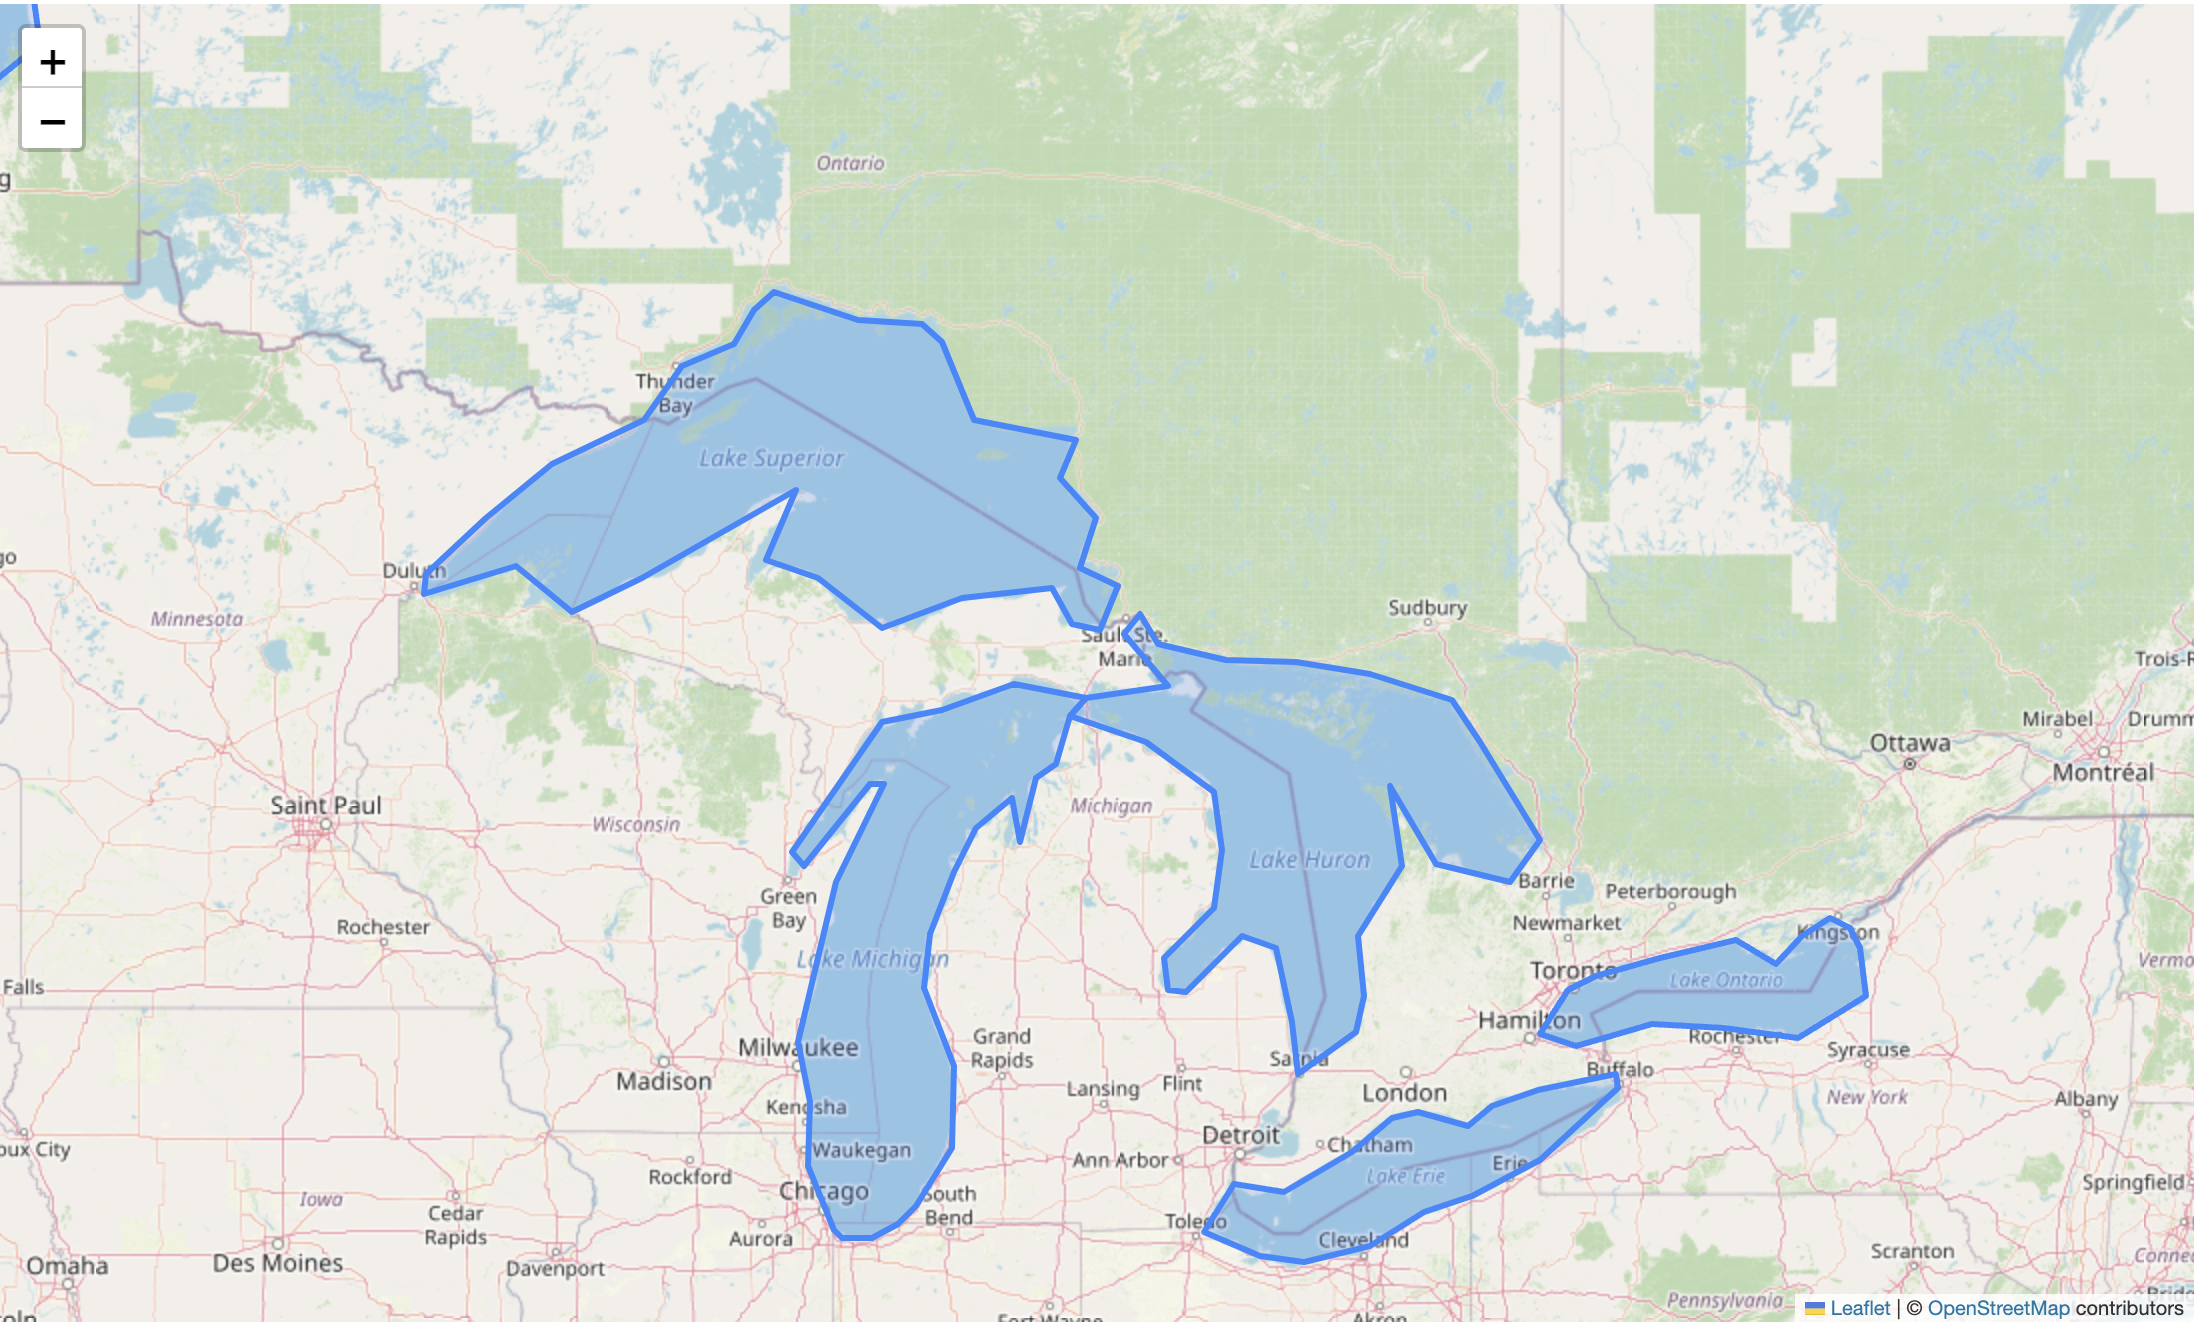
Running this code gives us a Folium map with the 25 lakes from geojson.xyz. The screenshot below shows the Great Lakes of North America.

If we want to edit these lake polygons, we need to introduce Geoman. We have
already rendered the html to ensure that the Geoman css and js scripts are
loaded after Leaflet is initialized. This sequence of rendering the html is
important as you risk placing the Geoman scripts before Leaflet is initiated if
you do not render the html explicitly. Folium does not have any methods for
where precisely in the html to inject these scripts. We want to avoid
post-processing the html by manually injecting the scripts. But given we have
rendered the html already, we can go ahead and add the Geoman scripts via a CDN
using Folium's get_root().header.add_child() method in the code snippet below.
This results in the correct placement of the scripts.
# Add the Geoman CSS and JS scripts to the map from a CDN

m.get_root().header.add_child(folium.CssLink('https://unpkg.com/@geoman-io/leaflet-geoman-free/dist/leaflet-geoman.css'))
m.get_root().header.add_child(folium.JavascriptLink('https://unpkg.com/@geoman-io/leaflet-geoman-free/dist/leaflet-geoman.min.js'))
We also need a bit of custom js to initialize the Leaflet-Geoman controls on the
map. The code is provided below. Note that Folium instantiates a map with a
specific identifier and we use the get_name() in our script to make sure we
are initiating the Geoman controls on the right variable.
# Build a custom JavaScript to initialize Leaflet-Geoman on the map

custom_js = f"""
    {m.get_name()}.pm.addControls()
"""

# Embed the custom JavaScript in the Folium map

m.get_root().script.add_child(folium.Element(custom_js))
After running this code, we can visualize the map and it will now have the Geoman controls.
# Visualize the map inline. You can now use Geoman to edit to Lake polygons.

m
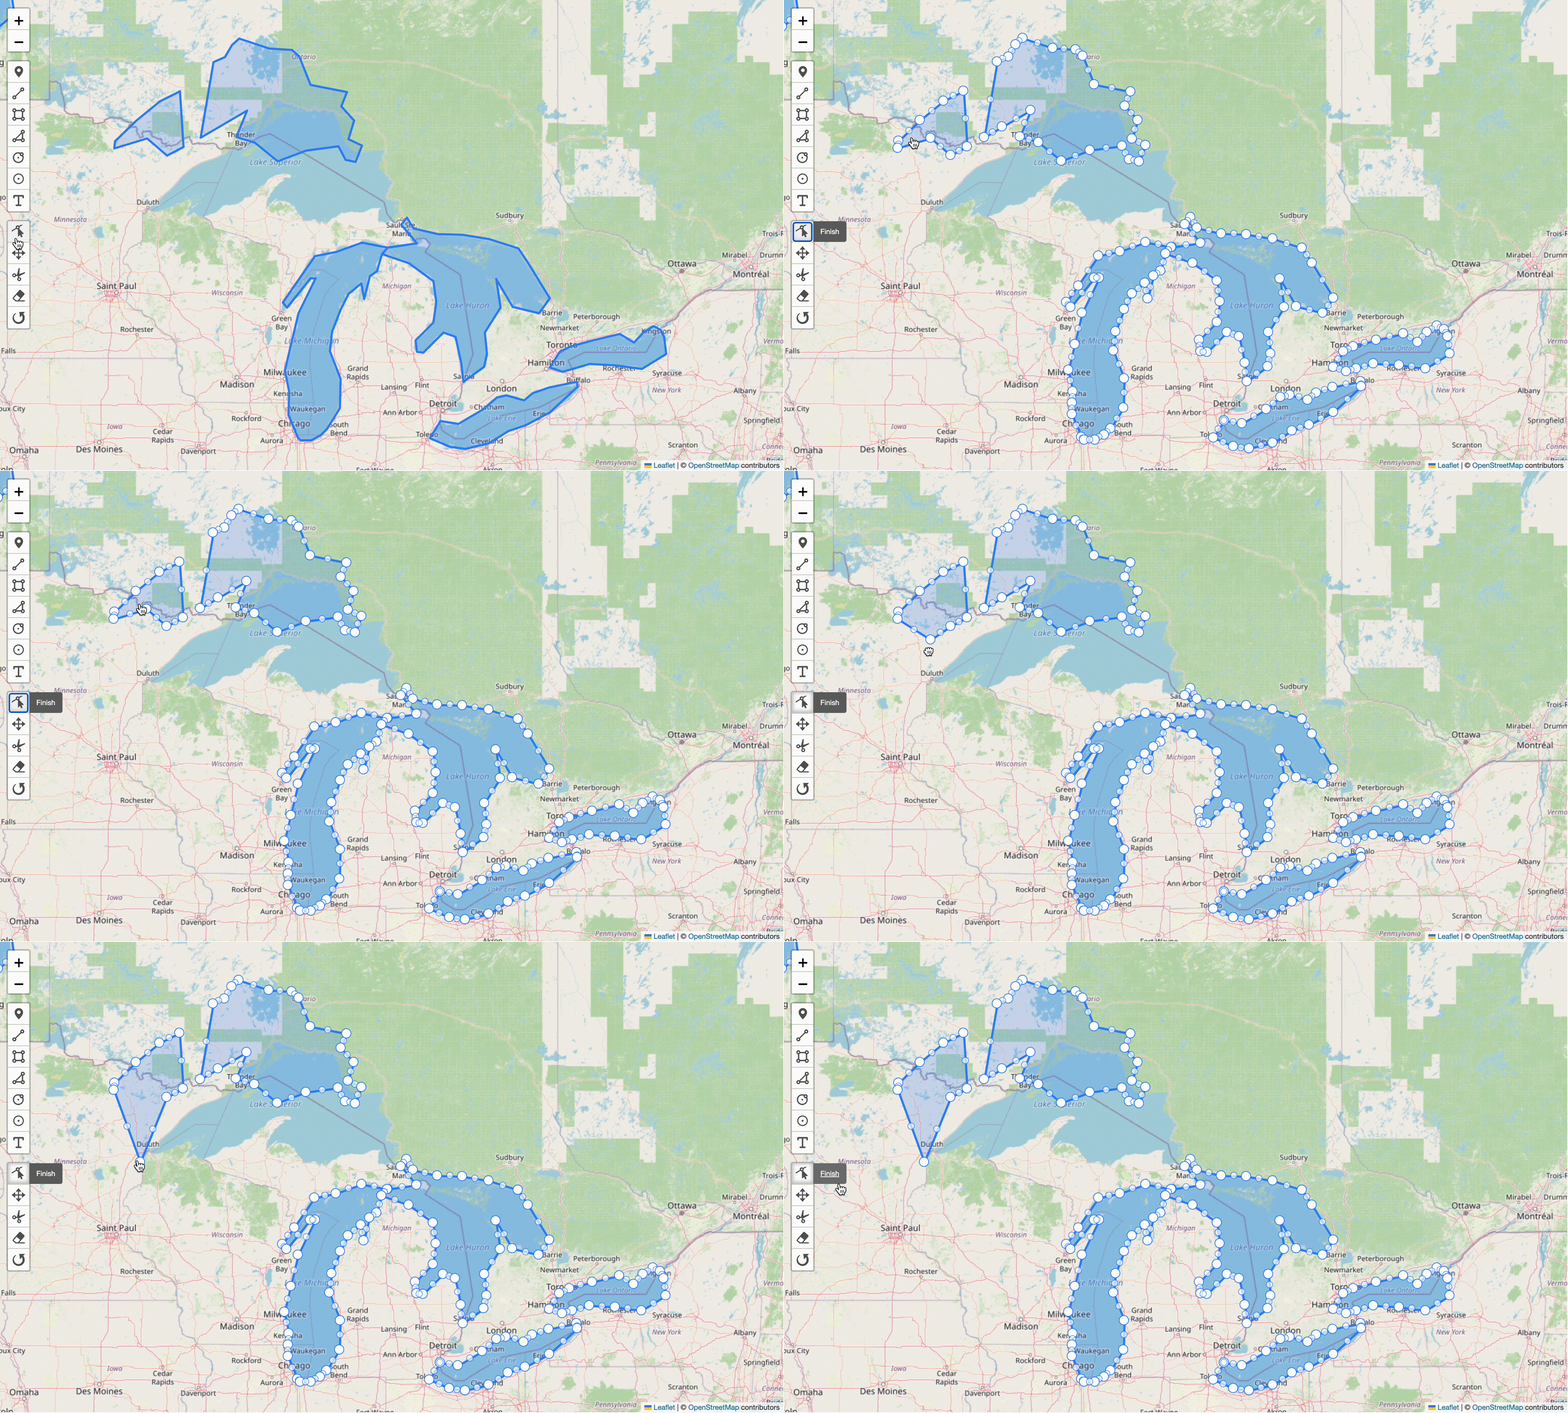
With the Geoman controls we can now easily manipulate the GeoJSON polygons with the common Geoman Modes (e.g. Edit, Drag, Cut).
Thank you for following along. This is very basic example of how to get up and running with Geoman in Folium. The examples lacks the logic for listening to events and the interactivity for updating the underlying data layer. You probably also have more interesting data sets to manipulate than the Great Lakes of North American, but hopefully it will help you get started. We are excited to see what you build!
If you have an interesting example of how you have used Geoman with Folium, you can share it on our GitHub Repo.
Want more geo-editing insights?
Get tips, tutorials, and product updates delivered to your inbox.
No spam. Unsubscribe anytime.


